
Building a Graph RAG Pipeline for Medical Records: From Theory to Production
- Nikhil Verma

- Apr 24
- 11 min read
How Knowledge Graphs Transform AI-Powered Healthcare Search
I have been building RAG systems for a while now. And for most use cases, the standard approach works fine — chunk your documents, embed them, store them in a vector database, and retrieve the most similar chunks when someone asks a question. Simple. Scalable. Gets the job done.
But then I tried to apply it to medical records.
And it fell apart almost immediately.
Not because the technology is bad. But because medical data is fundamentally different from the kind of data that vector search was designed for. When a doctor asks "how has this patient's kidney function trended over the past two years", the answer is not in a single document. It is spread across a dozen appointments, connected by a chain of diagnoses that evolved, treatments that changed, and lab values that shifted over time. Vector search has no concept of this. It retrieves fragments. Medicine needs the full story.
So I built something different. A system that combines the structural power of knowledge graphs with the semantic richness of vector search, orchestrated by a language model that knows when to use which. This is what I learned.
The Problem with Standard RAG in Healthcare
Let me be specific about where standard RAG fails, because the failure mode matters.
When you embed a patient's appointment record and store it in a vector database, you lose the connections. The January appointment that recorded the first bronchitis diagnosis becomes a chunk of text floating in high-dimensional space, with no explicit link to the February appointment that continued treatment, or the June appointment where that same bronchitis had evolved into something chronic.
When someone asks for the patient's diagnosis history, the vector search retrieves the chunks most semantically similar to "diagnosis history." Depending on what landed in the top-k, you might get three out of six appointments. The other three, including possibly the most important one — the initial presentation that explains everything that followed — are simply missing. And the system gives you no indication that anything is missing.
In most domains, this is a quality problem. In healthcare, it is a safety problem.
The second failure is temporal blindness. Vector search returns results ordered by semantic similarity, not by time. So even if all six appointments are retrieved, they arrive in random order. The language model tries to synthesize a coherent answer from what looks like a shuffled deck of cards.
The third failure is relational blindness. The fact that Patient J's renal disease in Stage 4 is the same condition that progressed to Stage 5, required dialysis, and eventually led to a kidney transplant — that continuity is invisible to vector search. Each appointment is an island.
The Solution: Graph + Vector + Smart Routing
The core idea is straightforward. Some questions have precise, structured answers that live in explicit relationships between entities. Other questions have answers that only exist in free-text clinical notes. And the most complex questions need both.
So we build a system that:
Stores structured medical data in a knowledge graph where relationships, timelines, and clinical chains are first-class citizens
Stores unstructured clinical notes in a vector database for semantic retrieval
Uses a language model to classify each incoming question and route it to the right retrieval strategy
Let me walk through exactly how this works in practice.
Part 1: Getting Data In — The Ingestion Pipeline
Before the system can answer any questions, it needs to understand what is in the records. This is the ingestion pipeline, and it is where most of the interesting engineering decisions live.
Here is what the pipeline looks like:

Reading through this diagram left to right, here is what is actually happening at each stage.
PDF medical records are the raw input. In our case, ten patients across two batches — an initial set of records and a follow-up batch six months later simulating how real records grow over time.
The PDF reader (we used a library called pdfplumber) extracts the raw text from each document. This sounds simple but medical PDFs are notoriously messy — scanned documents, inconsistent formatting, tables that do not parse cleanly. We preserve as much layout information as possible.
The LLM structured extractor is where the magic starts. Rather than trying to write brittle regex patterns to parse medical records, we send the raw text to a language model with a carefully designed prompt. The prompt asks the model to return a clean JSON object containing patient demographics, every appointment record, each diagnosis with its relationship type (is this a new diagnosis? a continuation of a prior one? did this condition evolve from something else?), lab results, treatments, and the full clinical notes. This extraction step is what allows us to preserve the semantic relationships that would otherwise get lost.
After extraction, the pipeline forks into two parallel paths.
The graph builder takes the structured data and loads it into Neo4j using a pattern called MERGE with ON CREATE and ON MATCH. This is important: if a diagnosis node already exists (because a prior appointment already created it), the graph builder finds the existing node and updates only its status and severity. It does not try to create a duplicate. New nodes are created with all their properties. Existing ones are updated gracefully. This is what makes the append-safe guarantee possible — you can ingest a new batch of appointment records without touching anything that already exists.
The chunk embedder takes the same appointment data, builds rich text representations (combining diagnosis names, lab values, treatment details, vitals, and full clinical notes into a single searchable document per appointment), and stores them in ChromaDB. Each chunk gets a deterministic ID generated from a hash of the patient name plus the appointment ID. This means if you ingest the same PDF twice, Chroma upserts the chunk in place rather than creating a duplicate. New appointments from new PDFs get new IDs and append cleanly.
The note at the bottom of the diagram is worth emphasizing: both systems behave identically with respect to append. New records always add to existing patient histories. Re-ingesting the same records never creates duplicates.
Part 2: Getting Answers Out — The Query Pipeline
Now someone asks a question. Here is what happens next.

The first thing the system does with any incoming question is send it to what we call the smart router. This is a language model call that classifies the question and returns a JSON object with two pieces of information: what retrieval mode to use (graph, vector, or hybrid), and which patient the question is about (a specific patient name, or "all" for questions that span the entire dataset).
The router has seen enough examples to reliably distinguish between question types. "What is Patient B's diagnosis history?" goes to the graph. "What clinical reasoning led to the medication change?" goes to vector. "Explain how Patient C's cardiac condition progressed and what drove each treatment decision" goes to hybrid. We measured about 85% classification accuracy in our testing, with most errors being conservative (routing hybrid questions to graph-only when the clinical reasoning was not strictly needed).
The graph path — shown in teal on the left — involves a second language model call. Rather than maintaining a library of handcrafted Cypher queries (Neo4j's query language), we give the model the complete graph schema and ask it to write the query that answers the question. This is remarkably robust. The model generally writes correct Cypher for a very wide range of questions. We include a fallback comprehensive query for the cases where the generated Cypher fails to execute.
The vector path — shown in coral in the middle — does what you would expect: embeds the question, runs a similarity search in ChromaDB filtered by patient name (normalized to lowercase to avoid case-sensitivity mismatches, which bit us in production), and retrieves the top matching chunks. If the metadata filter returns nothing, we fall back to an unfiltered search and post-filter the results.
The hybrid path — shown on the right — simply runs both retrieval paths and merges their outputs before proceeding.
All three paths converge at context assembly, where the graph results and vector chunks are combined into a single structured context block. Then the LLM synthesis stage takes this context and the original question and generates the final answer. The system prompt for this stage is mode-aware: a graph-only prompt tells the model it is working with structured relationship data; a vector-only prompt tells it to focus on clinical observations; a hybrid prompt tells it to use the graph for the timeline and the notes for the reasoning.
The answer is streamed back to the user.
Building the Test Dataset
To properly evaluate the system, we needed real enough data to expose the differences between approaches. We generated ten detailed patient profiles covering a realistic spread of medical scenarios:
Patient B has Type 2 diabetes that progressed from pre-diabetes, complete with peripheral neuropathy developing as glucose control worsened. Patient C suffered a STEMI heart attack and went through the full cardiac recovery journey including heart failure diagnosis, cardiac rehabilitation, and eventual near-complete recovery of cardiac function. Patient D dealt with depression and anxiety that manifested as physical symptoms — tension headaches and jaw clenching — that resolved as the psychiatric treatment worked. Patient E is a child with persistent asthma who started allergy immunotherapy. Patient F had a pregnancy complicated by gestational diabetes and pre-eclampsia. Patient G had a lumbar disc herniation, tried conservative treatment, needed surgery, and recovered to full work duty. Patient H was diagnosed with rheumatoid arthritis and achieved remission on biologic therapy. Patient I is an elderly patient whose mild cognitive impairment progressed to confirmed Alzheimer's disease. Patient J's chronic kidney disease progressed to end-stage and they received a living donor kidney transplant. Patient K sustained two sports concussions and went through the return-to-play protocol.
We generated each patient's records in two batches — an initial set covering the first year, and a follow-up batch covering the next six months. Ingesting both batches without clearing the database was a deliberate test of the append behavior.
What the Results Showed
When graph alone wins decisively
We asked: "What is Patient B's diagnosis history?"
The graph traversal returned all seven appointments in chronological order, showing the complete progression from pre-diabetes with A1C of 6.2 percent through the formal Type 2 diabetes diagnosis, the development of peripheral neuropathy, the addition of Ozempic when A1C crossed 7.0 percent, and the eventual near-normalization of A1C to 5.9 percent after six months. The full medication timeline was there: Metformin started, then dose-increased, then reduced as control improved. The neuropathy noted as developing, then as improving as glucose normalized.
Standard RAG retrieved three of seven appointment chunks — the ones most semantically similar to "diagnosis history." The initial pre-diabetes visit, which is the foundation of the entire story, was not in the top three. Neither were the 2025 follow-ups that showed the improvement. The answer described a diabetic patient with neuropathy on multiple medications. Factually based on what was retrieved, but missing most of the arc.
When vector search is essential
We asked: "What clinical reasoning led to Patient D's medication taper being slowed in March 2025?"
The graph returned structured data: PHQ-9 score of 5, Sertraline at 50mg, status continued. Correct but hollow.
The vector search returned the clinical note that contained the actual answer: the patient had a brief mood dip during the medication transition but managed it independently using the CBT skills they had learned. The doctor noted that the patient had just been offered a job promotion, that the mild anxiety spike was a healthy stress response rather than a relapse sign, and that this demonstrated the patient had internalized the therapeutic tools. That judgment call — the reasoning that distinguished relapse from healthy stress — existed only in the narrative notes. The graph had no way to encode it.
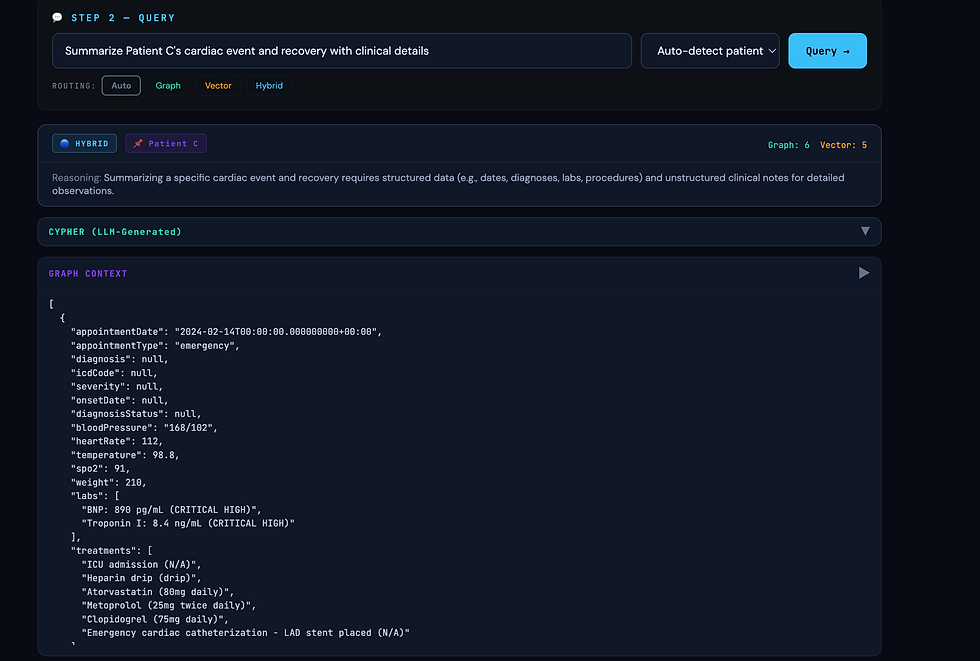
When hybrid is the only complete answer
We asked: "Summarize Patient C's cardiac journey from the initial event to full recovery, including what drove each treatment decision."
Graph alone gave a precise timeline: STEMI in February, stent placed, EF at 35 percent triggering HFrEF diagnosis, Entresto switch in January, EF recovering to 54 percent by March. Accurate. But dry. Nothing about why each decision was made.
Vector alone retrieved fragments of clinical notes: the reasoning for using Clopidogrel instead of aspirin because of the patient's prior GI bleed history, the reference to the PARADIGM-HF trial that justified the switch to Entresto, the physician's commentary on the patient's remarkable recovery. Rich context but without the timeline the notes were disconnected.
Hybrid gave the complete story. The timeline from the graph provided the skeleton. The notes from the vector search provided the clinical reasoning at each step. The language model wove them together into a coherent narrative that was both chronologically accurate and clinically meaningful.
The failure that matters most
We asked: "Show me Patient J's complete timeline from kidney disease diagnosis to transplant."
Standard RAG retrieved three to four chunks about kidney disease. The transplant appointment was not semantically close enough to "CKD diagnosis" to make the top-k cutoff. The answer described a patient on dialysis with no mention of the transplant that had already occurred.
This is not a minor quality issue. A physician relying on this system might make care decisions under the assumption that the patient is still on dialysis — when they have been off it for months and are now on immunosuppression. Graph traversal eliminated this failure entirely by following the relationship chain from the initial diagnosis through every stage to the transplant outcome.
Cross-patient queries
We asked: "Which patients had medications de-escalated or stopped in 2025?"
A single graph query spanning all ten patients correctly identified eight patients with medication changes: Patient B with Metformin reduced, Patient C with Clopidogrel discontinued, Patient D with Sertraline tapering and Montelukast stopped, Patient E with Flovent stepped down, Patient G with all pain medications stopped post-recovery, Patient H with Humira spacing reduced, Patient I with dialysis discontinued post-transplant, and Patient K with all athletic restrictions lifted.
Vector search retrieved five chunks from a mix of patients based on semantic similarity. No mechanism existed to systematically scan all patients' treatment records for a specific type of change.
What We Learned
Graph is not a replacement for vector search. In our testing, about 60 to 70 percent of questions were answerable from the graph alone. But the remaining 30 to 40 percent — the questions about clinical reasoning, physician judgment, and the why behind decisions — required the notes. And those are often the most important questions.
Schema design is the most important decision you make. Everything downstream — ingestion, querying, routing — flows from the graph schema. The CONTINUATION_OF and EVOLVED_FROM relationships between diagnosis nodes are what give the system its ability to reconstruct clinical narratives as connected chains rather than isolated events. If we had simply stored appointments and diagnoses as independent nodes without these relationship types, the graph would have been barely better than a relational database.
Null safety in LLM-extracted data is non-negotiable. The extraction step will return null fields, incomplete structures, and inconsistent naming. We hit this repeatedly in production. Every field that touches a database constraint needs a fallback. We generate deterministic IDs from content hashes when the model does not provide them.
Deduplication must be designed from the start. Without deterministic IDs in both Neo4j and ChromaDB, re-ingesting or appending data creates silent duplicates that degrade retrieval quality over time. We did not design this properly in the first version and spent more time fixing it than we would have spent designing it correctly from day one.
Standard RAG is a patient safety risk. This is the conclusion that surprised me most in its clarity. The top-k cutoff means that temporally distant but clinically critical records can simply fall out of scope. In domains where missing information might mean a doctor makes a wrong call, that is not acceptable. Graph traversal eliminates this failure mode for structured data because it follows relationships rather than measuring semantic distance.
The Bigger Picture
We built this for healthcare, but the problem is not specific to healthcare.
Any domain with deeply relational, temporally structured data faces the same challenge that standard RAG cannot solve alone: the answer is not in a single document, it is in the relationships between documents across time. Legal case history. Software incident timelines. Financial transaction patterns. Supply chain provenance. The structure is different but the limitation is the same.
The combination of Neo4j for structural traversal, ChromaDB for semantic retrieval, and a language model that knows when to use each produced something qualitatively different from either approach alone. It can follow a patient's story from first presentation through years of clinical evolution and explain not just what happened but why.
That is what intelligent retrieval looks like. Not finding the most similar chunk. Following the thread.
The complete code for this project — including the ingestion pipeline, the query router, and the testing GUI — is available in the accompanying repository. The patient data used for testing was synthetically generated and does not represent real individuals.
Test Results


Comments